
Page 59 - XL Axiata Integrated Anual Report 2020 ENG
P. 59
2020 Integrated Annual Report
57
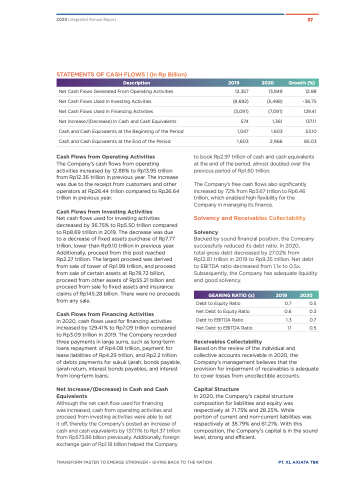
STATEMENTS OF CASH FLOWS | (In Rp Billion)
Description
Net Cash Flows Generated From Operating Activities
Net Cash Flows Used In Investing Activities
Net Cash Flows Used In Financing Activities
Net Increase/(Decrease) In Cash and Cash Equivalents Cash and Cash Equivalents at the Beginning of the Period Cash and Cash Equivalents at the End of the Period
Cash Flows from Operating Activities
The Company’s cash flows from operating activities increased by 12.88% to Rp13.95 trillion from Rp12.36 trillion in previous year. The increase was due to the receipt from customers and other operators at Rp26.44 trilion compared to Rp26.64 trillion in previous year.
Cash Flows from Investing Activities
Net cash flows used for investing activities decreased by 36.75% to Rp5.50 trillion compared to Rp8.69 trillion in 2019. The decrease was due to a decrease of fixed assets purchase of Rp7.77 trillion, lower than Rp9.10 trillion in previous year. Additionally, proceed from this post reached Rp2.27 trillion. The largest proceed was derived from sale of tower of Rp1.99 trillion, and proceed from sale of certain assets at Rp78.72 billion, proceed from other assets of Rp55.21 billion and proceed from sale fo fixed assets and insurance claims of Rp145.28 billion. There were no proceeds from any sale.
Cash Flows from Financing Activities
In 2020, cash flows used for financing activities increased by 129.41% to Rp7.09 trillion compared to Rp3.09 trillion in 2019. The Company recorded three payments in large sums, such as long-term loans repayment of Rp4.08 trillion, payment for lease liabilities of Rp4.29 trillion, and Rp2.2 trillion of debts payments for sukuk ijarah, bonds payable, ijarah return, interest bonds payables, and interest from long-term loans.
Net Increase/(Decrease) in Cash and Cash Equivalents
Although the net cash flow used for financing
was increased, cash from operating activities and proceed from investing activities were able to set
it off, thereby the Company’s posted an increase of cash and cash equivalents by 137.11% to Rp1.37 trillion from Rp573.86 billion previously. Additionally, foreign exchange gain of Rp1.18 billion helped the Company
2019
12,357
(8,692)
(3,091)
574
1,047
1,603
2020
13,949
(5,498)
(7,091)
1,361
1,603
2,966
Growth (%)
12.88
-36.75
129.41
137.11
53.10
85.03
to book Rp2.97 trillion of cash and cash equivalents at the end of the period, almost doubled over the previous period of Rp1.60 trillion.
The Company’s free cash flows also significantly increased by 72% from Rp3.67 trillion to Rp6.46 trillion, which enabled high flexibility for the Company in managing its finance.
Solvency and Receivables Collectability
Solvency
Backed by sound financial position, the Company successfully reduced its debt ratio. In 2020,
total gross debt decreased by 27.02% from Rp12.81 trillion in 2019 to Rp9.35 trillion. Net debt to EBITDA ratio decreased from 1.1x to 0.5x. Subsequently, the Company has adequate liquidity and good solvency.
GEARING RATIO (x)
Debt to Equity Ratio
Net Debt to Equity Ratio
Debt to EBITDA Ratio
Net Debt to EBITDA Ratio
Receivables Collectability
2019 2020
0.7 0.5
0.6 0.3
1.3 0.7
1.1 0.5
TRANSFORM FASTER TO EMERGE STRONGER – GIVING BACK TO THE NATION PT. XL AXIATA TBK
Based on the review of the individual and collective accounts receivable in 2020, the Company’s management believes that the provision for impairment of receivables is adequate to cover losses from uncollectible accounts.
Capital Structure
In 2020, the Company’s capital structure composition for liabilities and equity was respectively at 71.75% and 28.25%. While
portion of current and non-current liabilities was respectively at 38.79% and 61.21%. With this composition, the Company’s capital is in the sound level, strong and efficient.
