
Page 77 - XL Axiata Integrated Anual Report 2020 ENG
P. 77
2020 Integrated Annual Report
75
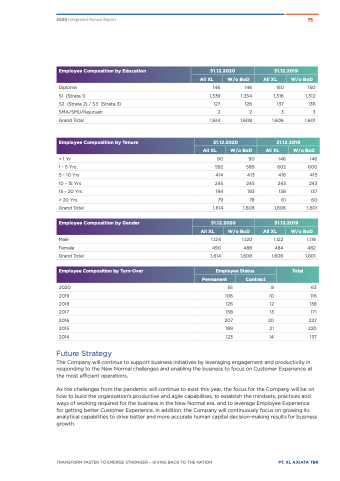
Employee Composition by Education 31.12.2020 31.12.2019
All XL W/o BoD All XL W/o BoD
Diploma 146
146
150 150
1,316 1,312
137 136
33
1,606 1,601
31.12.2019
S1 (Strata 1) 1,339 1,334
S2 (Strata 2) / S3 (Strata 3) 127 126
SMA/SMU/Kejuruan 2
2
1,608
Grand Total
Employee Composition by Tenure
< 1 Yr
1 - 5 Yrs
5 - 10 Yrs
10 - 15 Yrs
15 - 20 Yrs
> 20 Yrs
Grand Total
Employee Composition by Gender
Male
Female
Grand Total
Employee Composition by Turn-Over
1,614
31.12.2020
All XL
592
414
245
194
79
1,614
31.12.2020
90
90 146
589 602
413 416
245 243
193 138
78 61
1,608 1,606
W/o BoD
All XL
W/o BoD
146
600
415
243
137
60
1,601
31.12.2019
All XL
1,124
490
1,614
W/o BoD
1,120
488
1,608
All XL
1,122
484
1,606
8
10
12
13
20
21
14
W/o BoD
1,119
482
1,601
63
116
138
171
227
220
137
Employee Status
Total
2020 55
2019 106
2018 126
2017 158
2016 207
2015 199
2014 123
Future Strategy
Permanent
Contract
The Company will continue to support business initiatives by leveraging engagement and productivity in responding to the New Normal challenges and enabling the business to focus on Customer Experience at the most efficient operations.
As the challenges from the pandemic will continue to exist this year, the focus for the Company will be on how to build the organization’s productive and agile capabilities, to establish the mindsets, practices and ways of working required for the business in the New Normal era, and to leverage Employee Experience for getting better Customer Experience. In addition, the Company will continuously focus on growing its analytical capabilities to drive better and more accurate human capital decision-making results for business growth.
TRANSFORM FASTER TO EMERGE STRONGER – GIVING BACK TO THE NATION PT. XL AXIATA TBK
