
Page 76 - XL Axiata Integrated Anual Report 2020 ENG
P. 76
74
2020 Integrated Annual Report
MANAGEMENT DISCUSSION & ANALYSIS
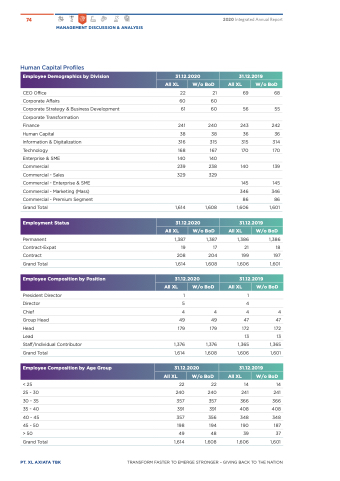
Human Capital Profiles
CEO Office
Corporate Affairs
Corporate Strategy & Business Development
Corporate Transformation
Finance 241
Human Capital 38
Information & Digitalization 316
Technology 168
Employee Demographics by Division 31.12.2020 31.12.2019
All XL W/o BoD All XL W/o BoD
22 21
60 60
61 60
69 68
56 55
243 242
36 36
315 314
170 170
140 139
145 145
346 346
86 86
1,606 1,601
31.12.2019
240
38
315
167
Enterprise & SME
140 140
Commercial
Commercial
Commercial
Commercial
Commercial
Grand Total
239
238
- Sales
- Enterprise & SME
- Marketing (Mass)
- Premium Segment
329 329
Employment Status
Permanent
Contract-Expat
Contract
Grand Total
Employee Composition by Position
President Director
Director
All XL W/o BoD
All XL
W/o BoD
1,386
18
197
1,601
1,614
31.12.2020
1,608
1,387 1,387 1,386
19 17 21
208 204 199
1,614 1,608 1,606
All XL
W/o BoD
All XL
W/o BoD
31.12.2020 31.12.2019
1
5
1
4
Chief 4444
Group Head
Head
Lead
Staff/Individual Contributor
Grand Total
Employee Composition by Age Group
< 25
25 - 30
30 - 35
35 - 40
40 - 45
45 - 50
49 49
179 179
1,376 1,376
1,614 1,608
31.12.2020
All XL W/o BoD
22 22
240 240
357 357
391 391
357 356
198 194
47 47
172 172
13 13
1,365 1,365
1,606 1,601
31.12.2019
All XL W/o BoD
14 14
241 241
366 366
408 408
348 348
190 187
39 37
1,606 1,601
>50 49
Grand Total 1,614
48
1,608
PT. XL AXIATA TBK TRANSFORM FASTER TO EMERGE STRONGER – GIVING BACK TO THE NATION
