
Page 56 - XL Axiata Integrated Anual Report 2020 ENG
P. 56
54
2020 Integrated Annual Report
MANAGEMENT DISCUSSION & ANALYSIS
FINANCIAL PERFORMANCE REPORT
The discussion and analysis of the financial performance refers to the financial statements as at and for the years ended 31 December 2020 and 31 December 2019, which have been audited by Kantor Akuntan Publik Tanudiredja, Wibisana, Rintis & Rekan (a member of the PricewaterhouseCoopers networks of firms). The Company’s audited financial statements presentation and disclosure have been developed and presented in accordance with the Indonesian Financial Accounting Standards.
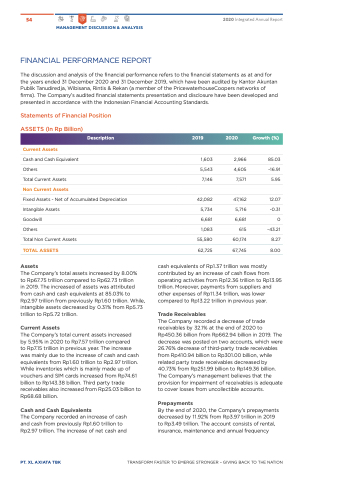
Statements of Financial Position ASSETS (In Rp Billion)
Current Assets
Cash and Cash Equivalent
1,603 2,966
Description
2019
2020
Growth (%)
85.03
-16.91
5.95
12.07
-0.31
0
-43.21
8.27
8.00
Others 5,543 4,605
Total Current Assets
Non Current Assets
Fixed Assets - Net of Accumulated Depreciation Intangible Assets
7,146 7,571
42,082 47,162
5,734 5,716
Goodwill 6,681 6,681
Others 1,083 615
Total Non Current Assets
TOTAL ASSETS
Assets
The Company’s total assets increased by 8.00%
to Rp67.75 trillion compared to Rp62.73 trillion
in 2019. The increased of assets was attributed from cash and cash equivalents at 85.03% to Rp2.97 trillion from previously Rp1.60 trillion. While, intangible assets decreased by 0.31% from Rp5.73 trillion to Rp5.72 trillion.
Current Assets
The Company’s total current assets increased
by 5.95% in 2020 to Rp7.57 trillion compared
to Rp7.15 trillion in previous year. The increase was mainly due to the increase of cash and cash equivalents from Rp1.60 trillion to Rp2.97 trillion. While inventories which is mainly made up of vouchers and SIM cards increased from Rp74.61 billion to Rp143.38 billion. Third party trade receivables also increased from Rp25.03 billion to Rp68.68 billion.
Cash and Cash Equivalents
The Company recorded an increase of cash and cash from previously Rp1.60 trillion to Rp2.97 trillion. The increase of net cash and
55,580 60,174
62,725 67,745
PT. XL AXIATA TBK
TRANSFORM FASTER TO EMERGE STRONGER – GIVING BACK TO THE NATION
cash equivalents of Rp1.37 trillion was mostly contributed by an increase of cash flows from operating activities from Rp12.36 trillion to Rp13.95 trillion. Moreover, payments from suppliers and other expenses of Rp11.34 trillion, was lower compared to Rp13.22 trillion in previous year.
Trade Receivables
The Company recorded a decrease of trade receivables by 32.1% at the end of 2020 to Rp450.36 billion from Rp662.94 billion in 2019. The decrease was posted on two accounts, which were 26.76% decrease of third-party trade receivables from Rp410.94 billion to Rp301.00 billion, while related party trade receivables decreased by 40.73% from Rp251.99 billion to Rp149.36 billion. The Company’s management believes that the provision for impairment of receivables is adequate to cover losses from uncollectible accounts.
Prepayments
By the end of 2020, the Company’s prepayments decreased by 11.92% from Rp3.97 trillion in 2019 to Rp3.49 trillion. The account consists of rental, insurance, maintenance and annual frequency
