
Page 51 - XL Axiata Integrated Anual Report 2020 ENG
P. 51
2020 Integrated Annual Report 49
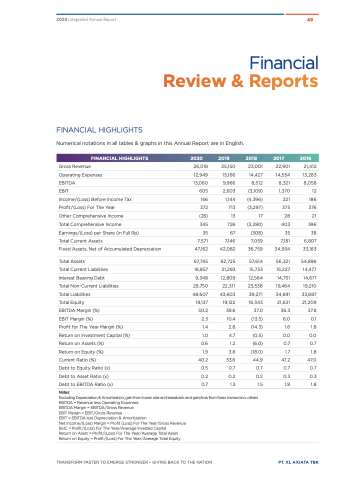
FINANCIAL HIGHLIGHTS
Numerical notations in all tables & graphs in this Annual Report are in English.
Gross Revenue
FINANCIAL HIGHLIGHTS
2020
26,018
12,949
2019
25,150
15,166
9,966
2,603
2018
23,001
14,427
8,512
(3,109)
(4,396)
(3,297)
17
(3,280)
(308)
7,059
36,759
57,614
15,733
12,564
23,538
39,271
18,343
37.0
(13.5)
(14.3)
(0.5)
(6.0)
(18.0)
44.9
0.7
0.2
1.5
2017
22,901
14,554
8,321
1,370
221
375
28
403
35
7,181
34,934
56,321
15,227
14,751
19,464
34,691
21,631
36.3
6.0
1.6
0.0
0.7
1.7
47.2
0.7
0.3
1.8
2016
21,412
13,283
8,058
12
186
376
21
396
38
6,807
33,183
54,896
14,477
14,671
19,210
33,687
21,209
37.8
0.1
1.8
0.0
0.7
1.8
47.0
0.7
0.3
1.8
Financial
Review & Reports
Operating Expenses
EBITDA 13,060
EBIT 605
Income/(Loss) Before Income Tax
Profit/(Loss) For The Year
Other Comprehensive Income
Total Comprehensive Income
Earnings/(Loss) per Share (in Full Rp)
Total Current Assets
Fixed Assets, Net of Accumulated Depreciation
Total Assets
Total Current Liabilities
Interest Bearing Debt
Total Non-Current Liabilities
Total Liabilities
Total Equity
EBITDA Margin (%)
EBIT Margin (%)
Profit for The Year Margin (%)
Return on Investment Capital (%)
Return on Assets (%)
Return on Equity (%)
Current Ratio (%)
Debt to Equity Ratio (x)
Debt to Asset Ratio (x)
Debt to EBITDA Ratio (x)
Notes:
146 1,144
372 713
(26) 13
345 726
35 67
7,571 7,146
47,162 42,082
67,745 62,725
18,857 21,293
9,348 12,809
29,750 22,311
48,607 43,603
19,137 19,122
50.2 39.6
2.3 10.4
1.4 2.8
1.0 4.7
0.6 1.2
1.9 3.8
40.2 33.6
0.5 0.7
0.2 0.2
0.7 1.3
Excluding Depreciation & Amortization, gain from tower sale and leaseback and gain/loss from forex transaction, others EBITDA = Revenue less Operating Expenses
EBITDA Margin = EBITDA/Gross Revenue
EBIT Margin = EBIT/Gross Revenue
EBIT = EBITDA less Depreciation & Amortization
Net Income/(Loss) Margin = Profit (Loss) For The Year/Gross Revenue RoIC = Profit/(Loss) For The Year/Average Invested Capital
Return on Asset = Profit/(Loss) For The Year/Average Total Asset Return on Equity = Profit/(Loss) For The Year/Average Total Equity
TRANSFORM FASTER TO EMERGE STRONGER – GIVING BACK TO THE NATION
PT. XL AXIATA TBK
