
Page 53 - XL Axiata Integrated Anual Report 2020 ENG
P. 53
2020 Integrated Annual Report
51
SHARES HIGHLIGHTS
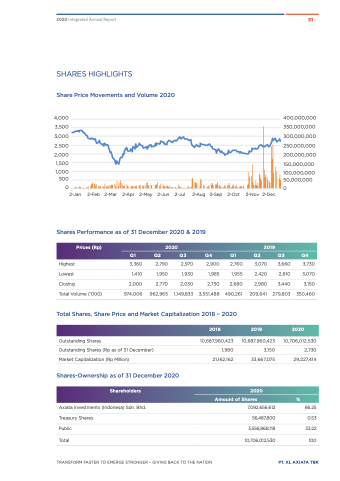
Share Price Movements and Volume 2020
4,000 3,500 3,000 2,500 2,000
1,500 1,000 500 0
Shares Performance as of 31 December 2020 & 2019
400,000,000 350,000,000 300,000,000 250,000,000 200,000,000 150,000,000
100,000,000
50,000,000
0
2-Jan 2-Feb 2-Mar 2-Apr 2-May 2-Jun 2-Jul 2-Aug 2-Sep 2-Oct 2-Nov 2-Dec
Prices (Rp) 2020 2019
Q1 Q2 Q3 Q4 Q1 Q2 Q3 Q4
Highest
Lowest
Closing
Total Volume (‘000)
3,360
1,410
2,000
974,006
2,790
1,950
2,770
962,965
2,970
1,930
2,030
1,149,833
2,900
1,985
2,730
3,551,488
2,760 3,070
1,955 2,420
2,680 2,980
3,660
2,810
3,440
279,803
Total Shares, Share Price and Market Capitalization 2018 – 2020
209,641
2019
10,687,960,423
3,150
33,667,075
2020
490,261
3,730
3,070
3,150
350,460
2020
10,706,012,530
2,730
29,227,414
%
66.25
0.53
33.22
100
Outstanding Shares
Outstanding Shares (Rp as of 31 December)
Market Capitalization (Rp Million)
Shares-Ownership as of 31 December 2020
Shareholders
Axiata Investments (Indonesa) Sdn. Bhd. Treasury Shares
2018
10,687,960,423
1,980
21,162,162
Amount of Shares
7,092,656,612
56,487,800
Public 3,556,868,118
Total 10,706,012,530
TRANSFORM FASTER TO EMERGE STRONGER – GIVING BACK TO THE NATION
PT. XL AXIATA TBK
